Case study · Government · 2020 to 2023
National road-safety observatory
A national road-safety observatory built from seven government data feeds
For a national road-safety authority in the GCC, we joined crash, ambulance, hospital, damage-cost, traffic-sensor, weather and demographic data into one platform, with locally calibrated crash-prediction models and bilingual decision dashboards. Delivered continuously from 2020 to 2023.
- government and operational data feeds joined in one warehouse
- 7
- government and operational data feeds joined in one warehouse
- commits across four years of continuous delivery
- 3,100+
- commits across four years of continuous delivery
- administrative regions covered
- 13
- administrative regions covered
- road types with locally calibrated crash-prediction models
- 3
- road types with locally calibrated crash-prediction models
The challenge
The authority's mandate was to cut road deaths, and the evidence sat in separate agencies. The transport ministry held crash records, the ambulance service held dispatch and arrival times, the health sector held hospital outcomes, damage assessors held repair costs and roadside sensors counted traffic. Each answered part of the question of where and why people die on the roads. None could answer it alone.
What we built
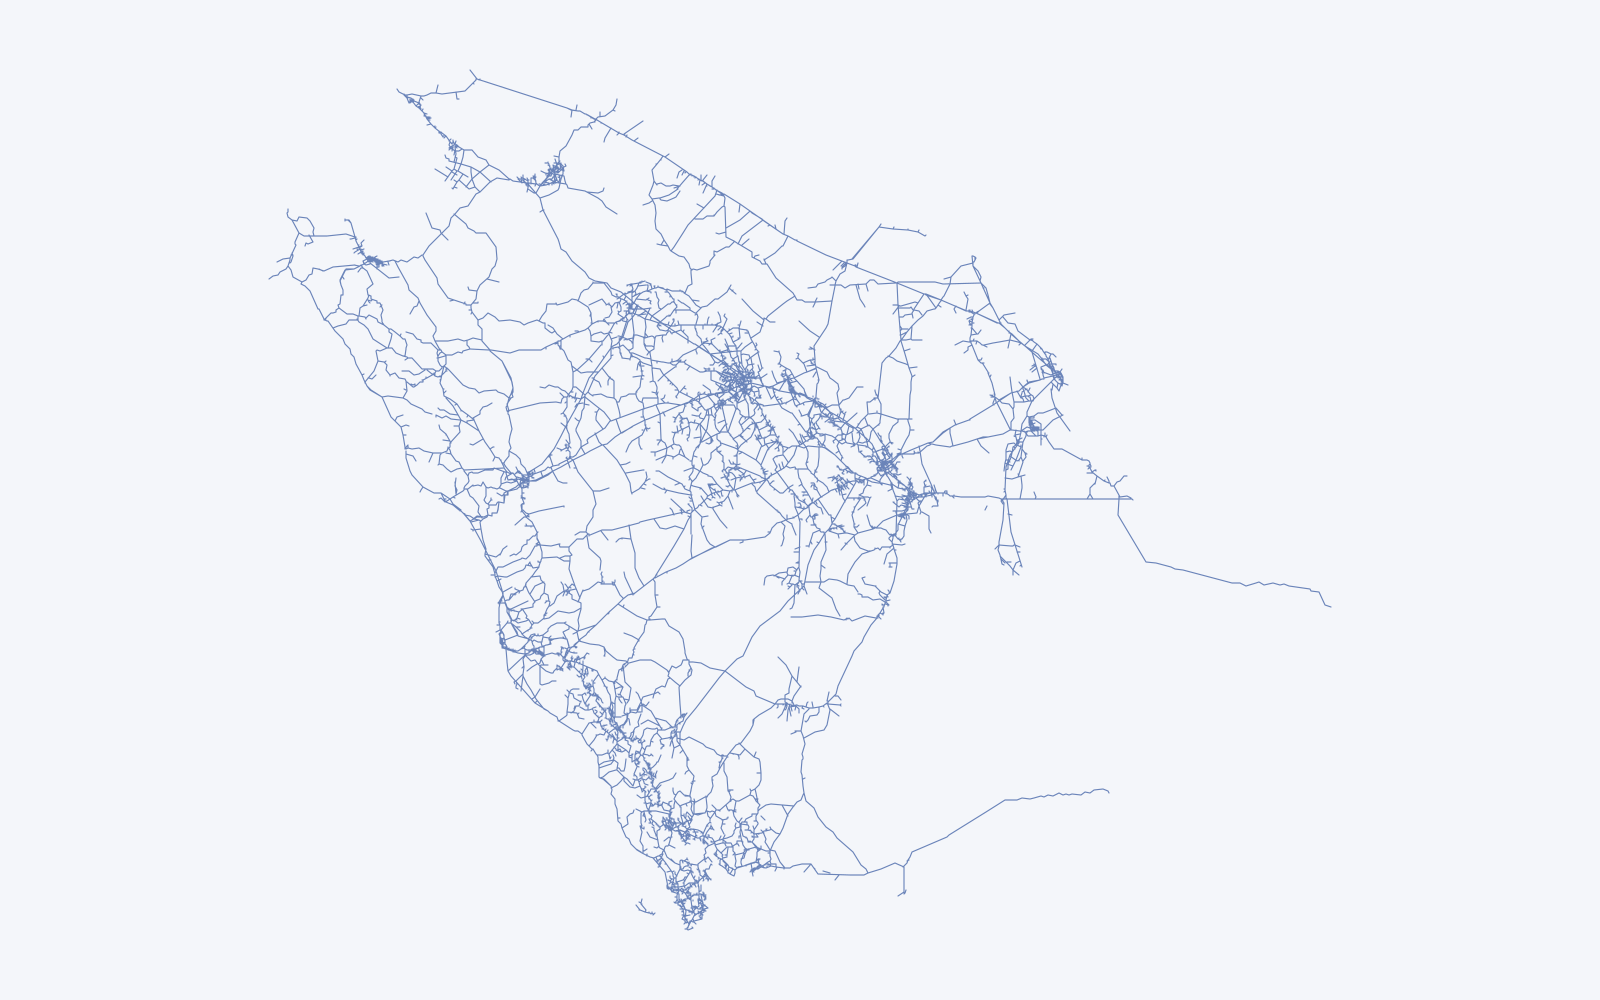
- One warehouse for seven feeds. Crash records, ambulance timings, hospital outcomes, vehicle-damage costs, traffic sensors (volume, average speed and 15 vehicle classes per lane), historical weather and national demographics, loaded into a distributed in-memory SQL warehouse.
- Ingestion analysts run themselves. A no-code pipeline builder connects MySQL, PostgreSQL, MongoDB, Cassandra and Kafka sources, accepts CSV, Excel and Esri geodatabase uploads of up to 5 GB, and shows the status of every pipeline.
- Decision dashboards in Arabic and English. About 60 analytical views, a safety-performance-indicator dashboard, quarterly reports and a crash-cost calculator based on the value of a statistical life.
- Crash prediction engineers can audit. Safety Performance Functions calibrated to local roads predict total, fatal-and-injury and damage-only crashes per year on multilane roads, freeways and two-lane roads, from traffic volume, speed, lane count, median and shoulder width and lighting. A recommender ranks countermeasures by their crash modification factors and the quality of the evidence behind them.
- An assistant prototype. In 2023 we added question answering over the observatory's reports, with a locally hosted model option for sensitive data.
Why statistical models
Road engineers sign off on interventions that cost millions. They need models whose coefficients they can read and challenge, and Safety Performance Functions are the established method in highway-safety practice. We calibrated them to local roads and kept every term visible.
Delivery and DevOps
The platform shipped continuously for four years: 3,128 commits from about ten engineers between April 2020 and December 2023, with branch-per-developer work and reviewed pull requests. Services ran in Docker containers behind nginx and were managed with Rancher, which let us move the whole platform onto the client's own in-country infrastructure without a rewrite.
Results
- Crash, response, health and cost data joined in one warehouse covering all 13 administrative regions.
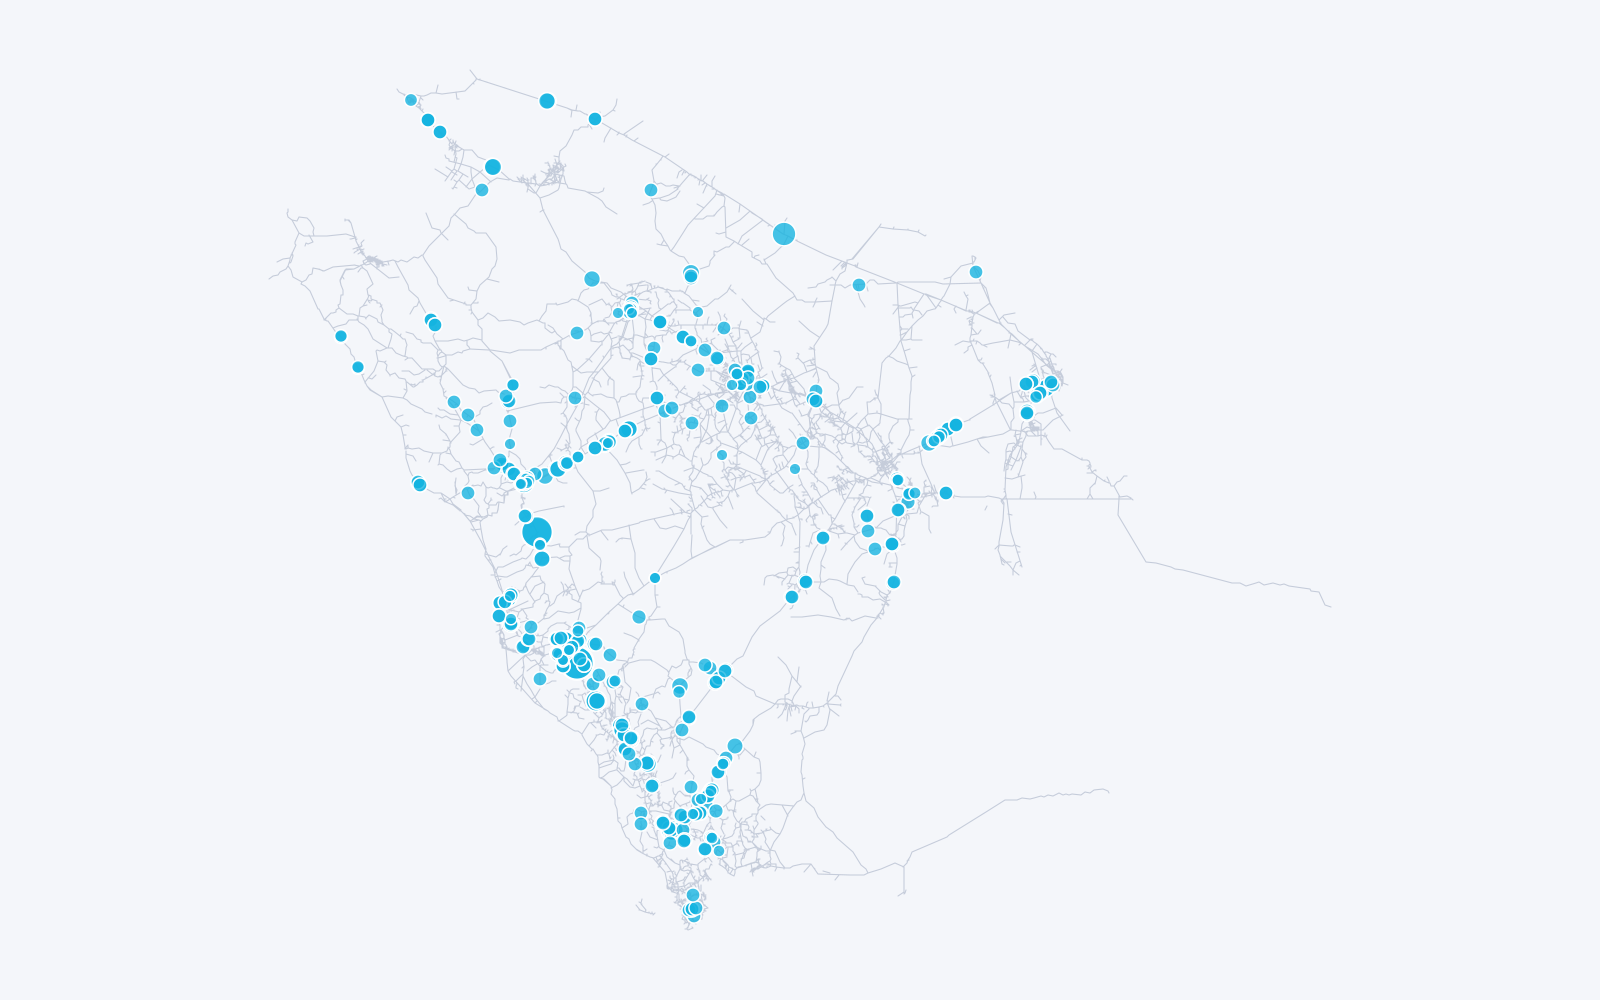
- 460 priority hotspots identified on the national network. See how we found them.
- Quarterly reports in Arabic and English generated from the platform.
Platform and infrastructure
This platform runs on the client's in-country infrastructure, as data-residency rules require. The same containerised pattern, a distributed SQL warehouse with ingestion services managed by Rancher, is what we now run on Azure Virtual Machines for our capital-markets work.